Stop Looking at the Average—Here's How to Really Compare Mortgage Rates
Quick Takeaway
Most mortgage rate websites show you just one number—the average. But knowing the average doesn't tell you if your quote is actually good. Mortgage-Rates.ai shows you the full picture: which lenders are offering what rates right now, across more than 550 lenders covering over 36% of the market. Instead of wondering if you got a fair deal, you can actually see where your quote falls compared to everyone else.
The Problem with Averages
When you search for mortgage rates online, you'll find the same thing everywhere: an average rate for the day. Sites like Mortgage News Daily publish daily rate indexes. Freddie Mac's Primary Mortgage Market Survey releases weekly averages based on thousands of loan applications. The Optimal Blue Mortgage Market Indices track actual locked rates from about 35% of the market.
These benchmarks are useful for tracking whether rates are going up or down. But here's what they don't tell you: Is YOUR quote any good? An average is just one number. It hides the fact that some lenders are charging way more than others—even to borrowers with identical credit scores, down payments, and loan amounts.
The Hidden Spread Nobody Talks About
Research from the Urban Institute found that borrowers with the exact same profile can be offered rates that are 50 basis points apart—that's half a percentage point. Over a 30-year loan, that difference could cost you over $100 a month, or tens of thousands of dollars total. And according to the Consumer Financial Protection Bureau, nearly half of all borrowers don't even shop around before picking a lender.
A Fannie Mae study found that one-third of recent homebuyers got only one quote before signing. Their top reason? They felt "comfortable" with the first lender they talked to. But comfort doesn't mean you got the best deal—it usually just means you didn't look at your other options.
Why Borrowers Feel Lost
The mortgage industry is hard to navigate on purpose. According to a consumer survey by Own Up, more than two-thirds of people found shopping for a mortgage "moderately to very challenging." Over half said they didn't even know they could comparison shop. And when asked about APR—one of the most important numbers in a loan offer—most people admitted they didn't really know how to use it to compare deals.
Freddie Mac's research shows that getting just one extra quote could save an average of $1,500 over the life of a loan. Getting five quotes? About $3,000 in savings. Yet most people don't bother because comparing loans feels too complicated.
Why Averages Aren't Enough for You
Say the average 30-year fixed rate today is 6.25%. You get a quote at 6.375%. Is that good or bad? The average alone can't tell you. Maybe most lenders are actually clustered around 6.125%, and your lender is charging on the high end. Or maybe rates are spread out evenly and you're right in the middle. Without seeing the distribution, you're flying blind.
This is the core problem: averages flatten out reality. They take a whole range of offers—from great deals to overpriced ones—and squash them into a single number. That's useful for economists tracking market trends. It's not useful for you, trying to figure out if you should accept your quote or keep shopping.
What That Rate Difference Actually Costs You
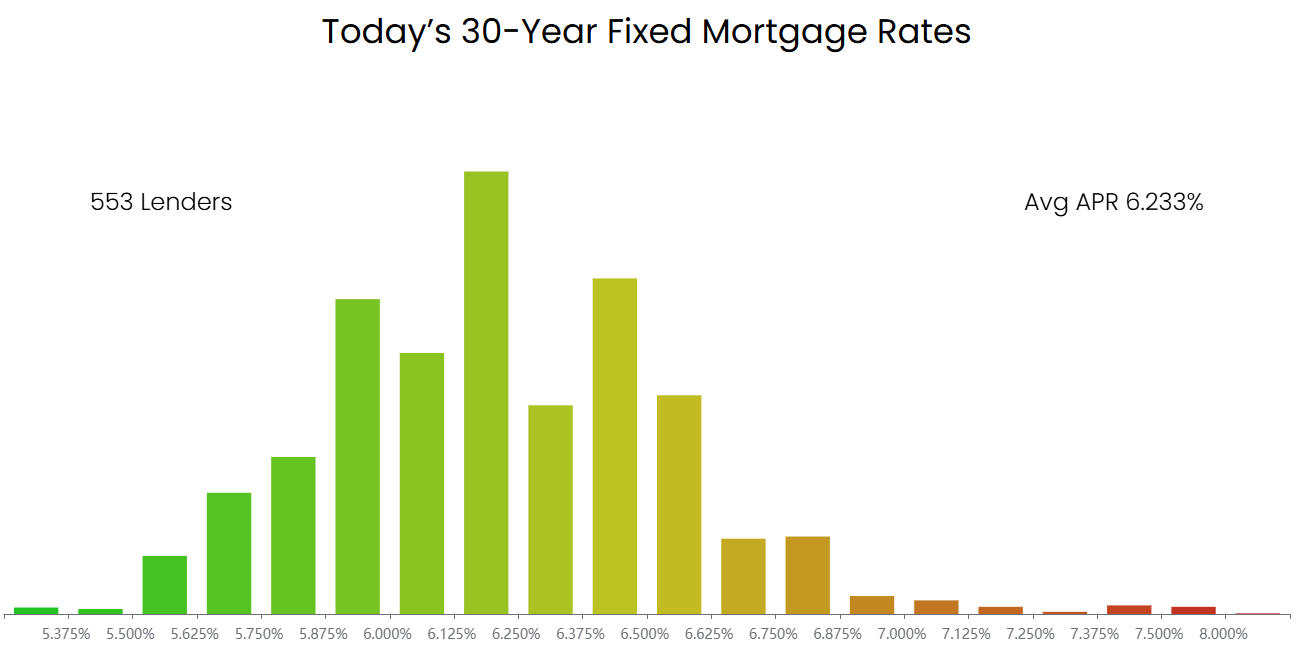
Let's put real numbers to this. Right now, the average 30-year fixed rate sits around 6.2%. But on our distribution chart, you can see lenders offering rates as low as 5.5%. That 0.7% gap might sound small—but it's not. On a $300,000 loan, choosing the lower rate saves you about $134 per month and nearly $48,000 in total interest over the life of the loan. Borrowing $600,000? You'd save around $268 monthly and close to $97,000 in total interest. And if you're financing $900,000, that difference grows to roughly $400 per month and almost $145,000 in interest savings. That's real money—potentially enough for a kitchen renovation, your kid's college fund, or years of retirement. And you'd never know these lower rates existed if all you looked at was the average.
See the Whole Picture with a Distribution Chart
This is exactly why we built the rate distribution chart at Mortgage-Rates.ai. Instead of showing you one average number, we show you how rates are actually distributed across the market—in 0.125% buckets. You can see at a glance where most lenders are clustering, what the lowest available rates are, and how many lenders are at each level.
Even better: you can click on any bar in the chart and see exactly which lenders are offering that rate. No more guessing. No more wondering if you could do better. You can compare your quote directly against what's available right now.
More Than 550 Lenders, Over 36% of the Market
The chart isn't based on a small sample or a handful of big banks. We track rates from more than 550 lenders, covering over 36% of the mortgage market. That's a truly representative snapshot of what's happening in the industry—not a narrow slice that might not apply to you.
Mortgage rates follow a normal distribution, meaning most lenders cluster around a central point, with fewer lenders at the extreme highs and lows. Our chart lets you see this pattern clearly. If your quote falls in the middle of the bell curve, you know you're getting a typical offer. If it's way out on the expensive end, you know it's time to get more quotes.
Good for Borrowers, Good for Everyone
This kind of transparency helps everyone. Borrowers can make smarter decisions and avoid overpaying. Lenders with competitive rates get more visibility. And the whole market works better when people can easily compare their options.
The CFPB has tried to create similar tools, but most borrowers don't know they exist. And those tools still focus on averages rather than showing the full spread of what's available. We think the distribution approach is a better way to give you the information you actually need.
Stop Guessing, Start Comparing
If you're shopping for a mortgage, don't settle for knowing the average. Visit Mortgage-Rates.ai and use our rate distribution chart to see where your quote really stands. It takes the mystery out of mortgage shopping—and could save you thousands of dollars.
The mortgage rates displayed on this site are collected daily from publicly available sources provided by more than 600 lenders. Mortgage-Rates.ai does not receive compensation for listing these rates, and all rates are presented as published by the respective lenders. While every effort is made to ensure accuracy, the information may contain errors or omissions. Mortgage rates are highly dependent on an individual’s financial circumstances, credit profile, loan terms, and other factors. As such, the rates you are quoted directly by a lender may differ materially from the rates displayed here.
Users should contact lenders directly to obtain formal, binding loan offers. If you identify any discrepancies in the data or would like to have your institution’s rates included, please contact us at content@mortgage-rates.ai
All logos, trademarks, and brand names appearing on this website are the property of their respective owners.
About the author
mortgage-rates.ai